May 28, 2025
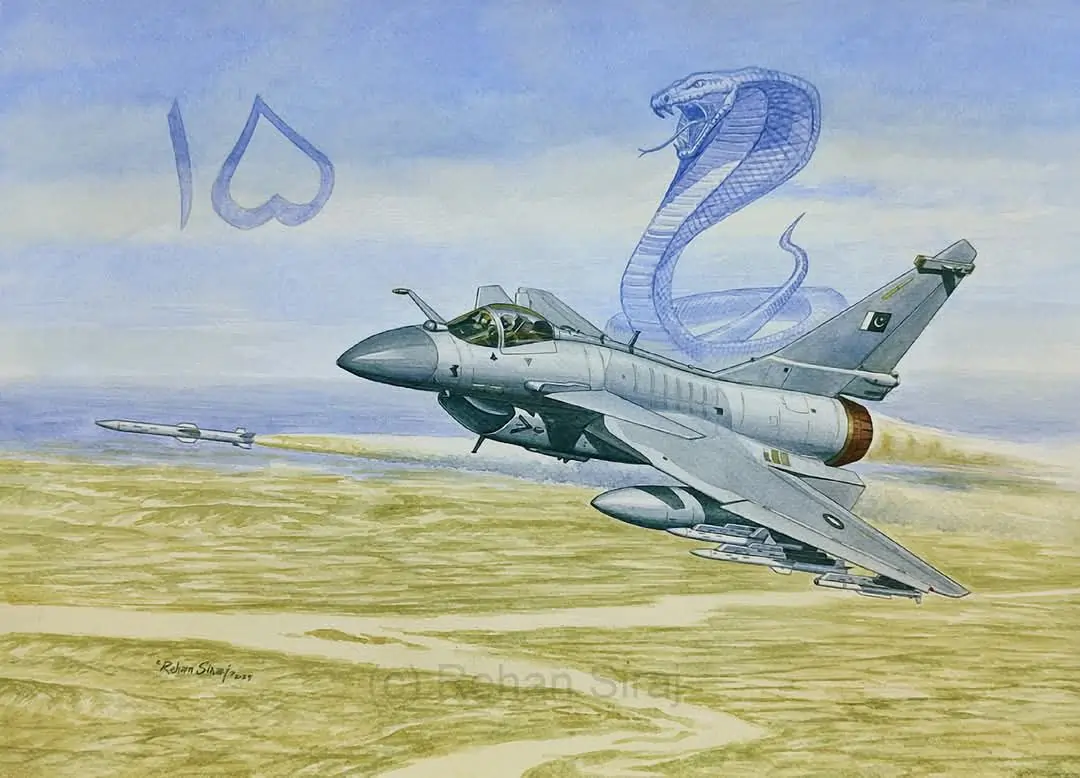
Over the weekend, I was engaged in a serious discussion to filter out the rhetorical noise and doubts from what PAF achieved in the air battle. As the gentlemen were from the engineering community within our defence sector, I told them about the mathematical reasoning of sorts that I used for myself to comprehend what had just happened in our lifetimes — and why I was so sure about the outcome. I used an age-old and very quantitative method: binomial probability. Just a simple coin-flip probability –– foundational in military operational research and basic fingertip air combat modelling. I stripped the outcomes of all abstractions (like morale, training, surprise) or qualitative parameters (Link 16 vs Link 17, PL-15 vs PL-15E, etc.) and based it purely on number of assets, attrition rate, combat duration, and observed outcome. Brutally simple. This gives us the raw firepower potential, assuming each aircraft gets one clean BVR kill attempt. Of course, PAF and such air forces have very complex differential equations and Newton-Raphson convergence algorithms to model and predict a real battle. I just used the fingertips, lol.
Ranked Assured Kill Probability for World’s Top BVR Missiles
The baseline approach was to rank the world’s top BVR missiles by a largely agreeable open-source probability-of-kill estimate — from AIM-120C/D at 0.20–0.35 to Derby at 0.08–0.10. This gives us a plausible relative outlook of these missiles –– the final spears in all the network, infrastructure, and kill chains. Then, applying it to an estimated force composition of both IAF and PAF, we assigned realistic kill probabilities per aircraft type. On the Indian side, 14 Rafales (Meteor) were the centre of gravity, with Su-30MKIs (R-77/Astra Mk1) and MiG-29s (R-77) acting in escort roles, while Mirage 2000s (MICA) were in the strike role. This campaign package gave us an expected kill score of ~8.7 based on our loose probabilistic raw firepower estimation. On the shooter side, PAF’s 14 J-10Cs (PL-15 EBV), with JF-17 Block IIIs (PL-15E) and Block IIs (likely SD-10A), translated to an expected ~5.76 kills.
| Missile | Country | Range (km) | Guidance | P(kill) Estimate | Combat Use / Notes |
|---|---|---|---|---|---|
| AIM-120C/D (AMRAAM) | USA | 105–180 | Active radar, datalink | 0.20 – 0.35 | Proven in multiple conflicts; D variant most effective |
| Meteor | UK/France/EU | 150 – 200 | Active radar + datalink + ramjet | 0.22 – 0.30 | Highest NEZ; highly resistant to jamming |
| PL-15 | China | ~300 (est.) | AESA radar, datalink | 0.20 – 0.30 | No public use; assumed based on AESA and performance claims |
| PL-15E | China (export) | ~145–180 | AESA radar, downgraded | 0.15 – 0.20 | Export variant; likely reduced range and ECCM |
| R-77 (AA-12 Adder) | Russia | ~80–110 | Active radar, datalink | 0.08 – 0.12 | Used in limited conflicts; effectiveness debated |
| Astra Mk1 | India | ~110 | Active radar, limited ECCM | 0.10 – 0.13 | Deployed on Su-30MKI; indigenous capability |
| MICA (EM) | France | ~80 | Active radar | 0.10 – 0.13 | Used by Mirage 2000, Rafale; solid but not Meteor-class |
| Derby | Israel | ~50–70 | Active radar | 0.08 – 0.10 | Used on LCA Tejas; older tech |
| SD-10A | China | ~70–100 | Active radar | 0.10 – 0.13 | Used on JF-17; comparable to R-77 |
Binomial-based Expected Kills
$$ P_{IAF} = 14 \times 0.25 + 24 \times 0.11 + 12 \times 0.13 + 10 \times 0.10 \approx 8.70 $$ $$ \bar{p}_{IAF} = \frac{8.70}{60} \approx 0.145 $$
$$ P_{PAF} = 14 \times 0.20 + 10 \times 0.20 + 8 \times 0.12 \approx 5.76 $$ $$ \bar{p}_{PAF} = \frac{5.76}{32} \approx 0.18 $$
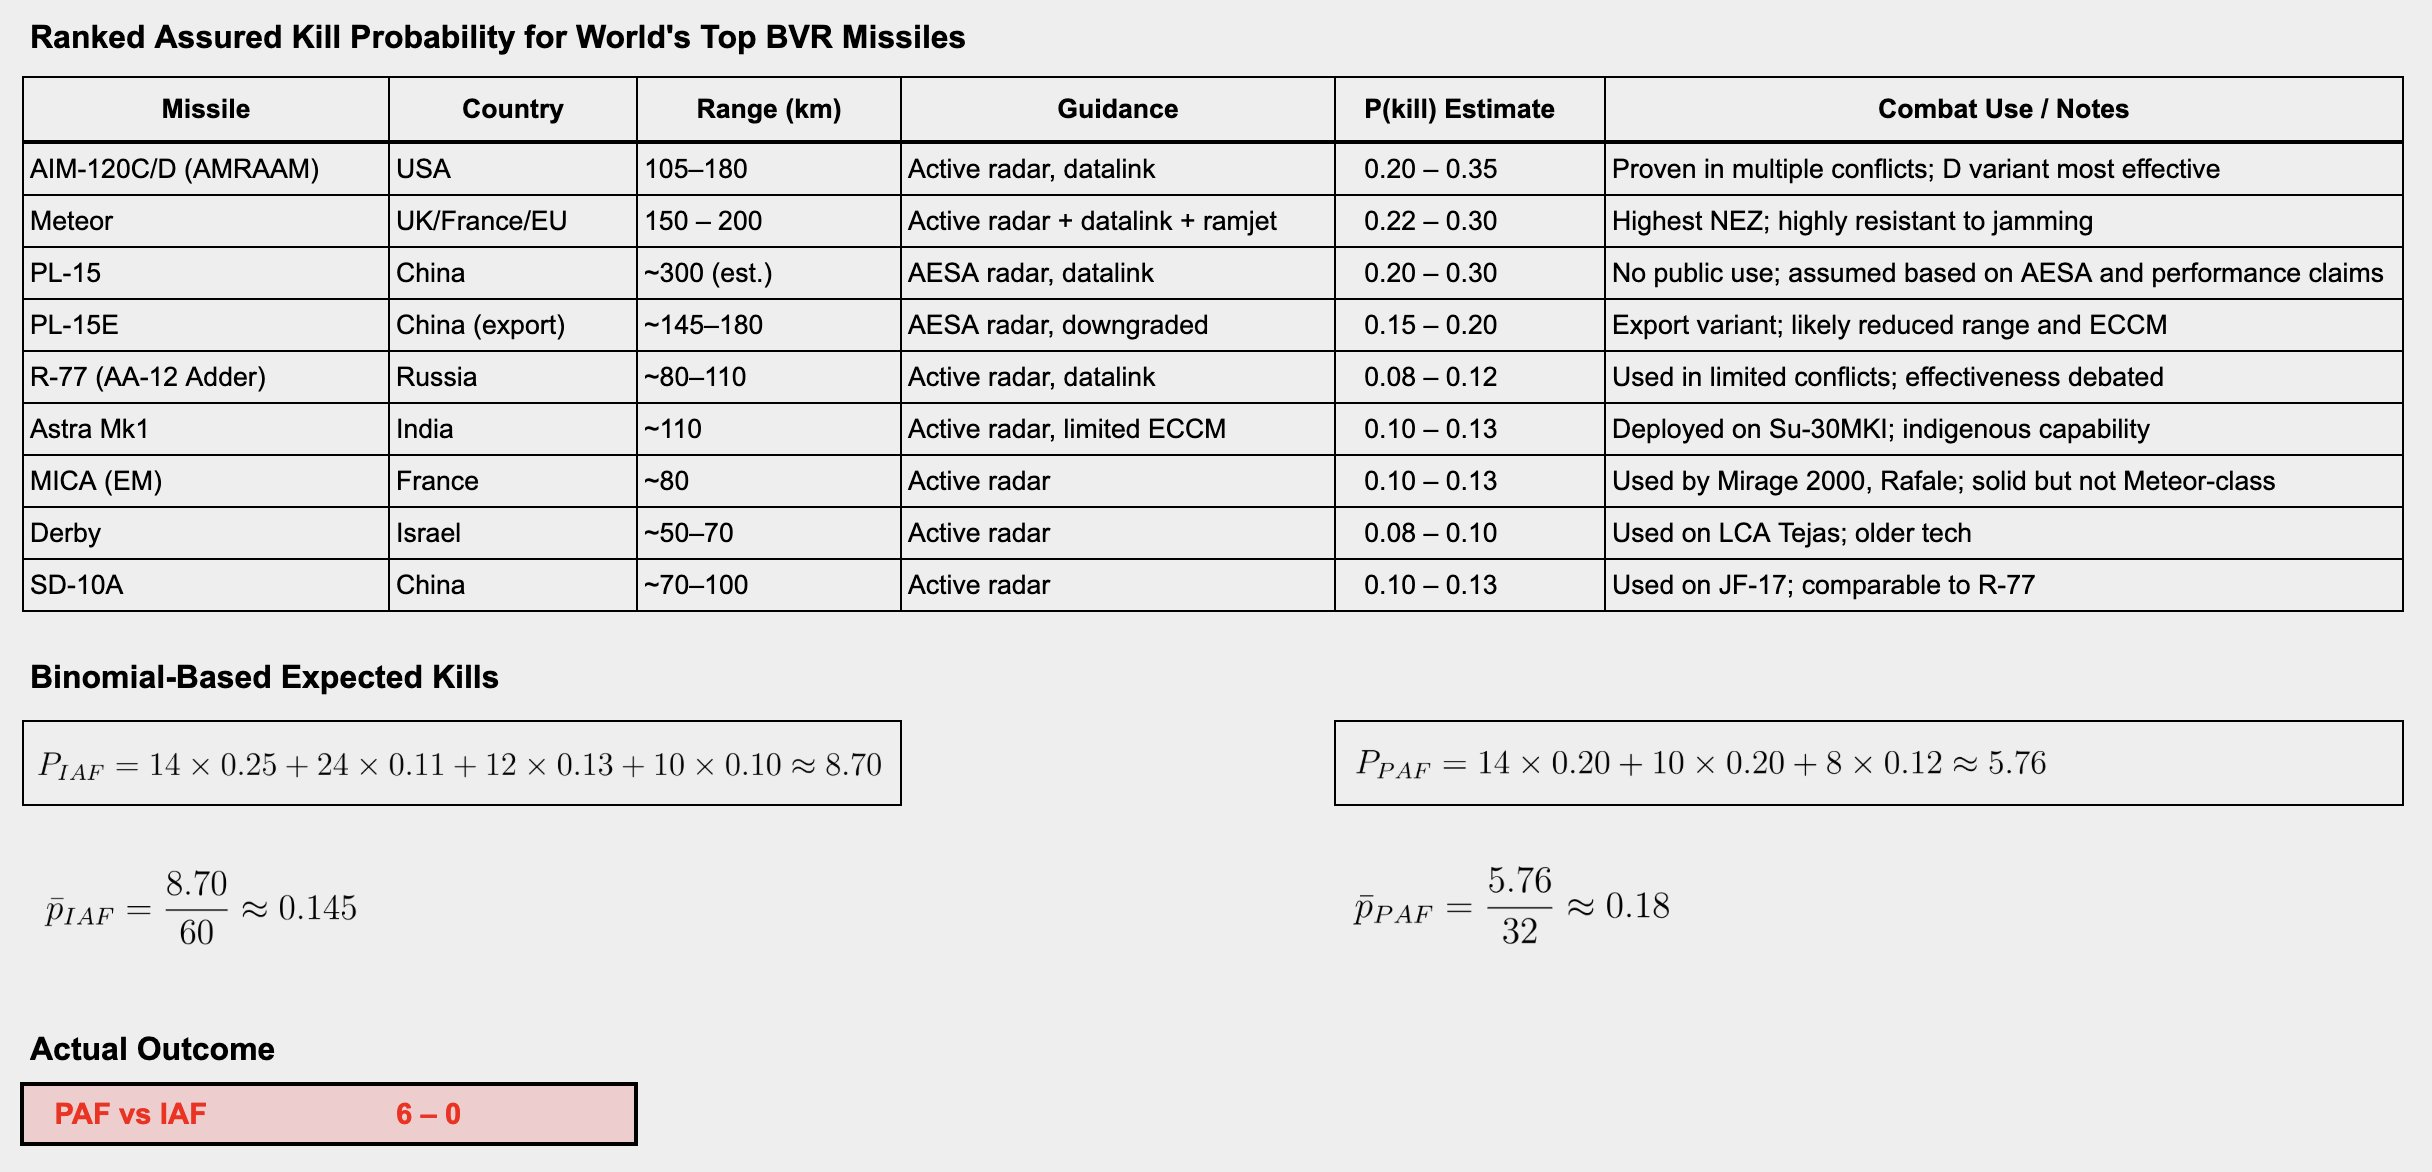
And lo and behold — PAF performed to the script. From the actual outcome, we saw 6 confirmed kills and one MALE UAV from the IAF package eliminated. But what changes the stakes is this: PAF not only hit its expected score — it did so while receiving 0 of its own expected attrition. Not lower-than-expected losses. Zero. The expected reciprocal loss for PAF was 6–7 aircraft. Instead of the projected 0.66:1 exchange ratio, we got ∞:0. This isn’t high performance. This is when the probability curve bends. PAF didn’t just outperform—they broke the model.
Monte Carlo Simulation (10,000 runs) – Theoratical
So how rare is this? Based on asset count alone, Pakistan’s chance of a dominant outcome was 37%, India’s 63%. But raw counts don’t decide battles — timing, integration, decision loops do. To probe further, we assumed 10,000 Monte Carlo simulations theoretically, using the exact same force parameters. The outcome should be that in 88% of outcomes, India should have scored at least two kills. A 6:0 result in favour of PAF should occur in fewer than 3 out of 1,000 outcomes. That’s not a tactical win. That’s a statistical outlier — meaning systemic or technological disruption occurred.
| Metric | IAF | PAF |
|---|---|---|
| Mean kills (E[X]) | ~8.70 | ~5.76 |
| Std deviation (√np(1–p)) | ~2.94 | ~2.11 |
| % of runs with 0 kills | ~0.11 | ~4.8 |
| % of runs where: 6 kills (PAF) + 0 kills (IAF) | <0.3% |
OODA & Kill Chain Diagnostic
So what caused it? India’s effective kill probability was far lower — degraded by jamming, kill chain disruption, cyber denial — and PAF gained first-launch advantage through superior tactical execution. This brings us to OODA. PAF’s kill chain integrity held at ~87%. India’s collapsed by over 60%. The enemy never completed its decision loop. They couldn’t. Their kill architecture was denied, jammed, confused, broken. As I speculated earlier, the math confirms what was visible from above — a smaller force, acting faster, tighter, and smarter, owned the engagement space.
PAF Kill Chain Integrity
| Step | PAF Score (1–5) | Notes |
|---|---|---|
| Detection | 5 | Erieye + early launch |
| Tracking | 4 | Tight integration |
| ID/Targeting | 4 | Clear air picture |
| Weapon Release | 5 | Rapid first-launch |
| Guidance | 4 | PL-15 or E-grade |
| Impact | 4 | Confirmed kills |
| Total | 26/30 | ~87 Integrity |
IAF Kill Chain Integrity
| Step | IAF Score (1–5) | Notes |
|---|---|---|
| Detection | 4 | Phalcon + Netra |
| Tracking | 3 | Disrupted |
| ID/Targeting | 2 | Jammed |
| Weapon Release | 2 | Ineffective |
| Guidance | 1 | No hits |
| Impact | 0 | 0 kills |
| Total | 12/30 | ~40 Integrity |
The binomial reasoning shows that PAF achieved exactly what it should have. IAF achieved nothing it was statistically expected to. Monte Carlo estimations show that such a result is extremely rare without some form of systemic breakdown. And OODA analysis shows why that breakdown occurred. But if you want to measure just how severe the damage was — Lanchester’s Law closes the case.
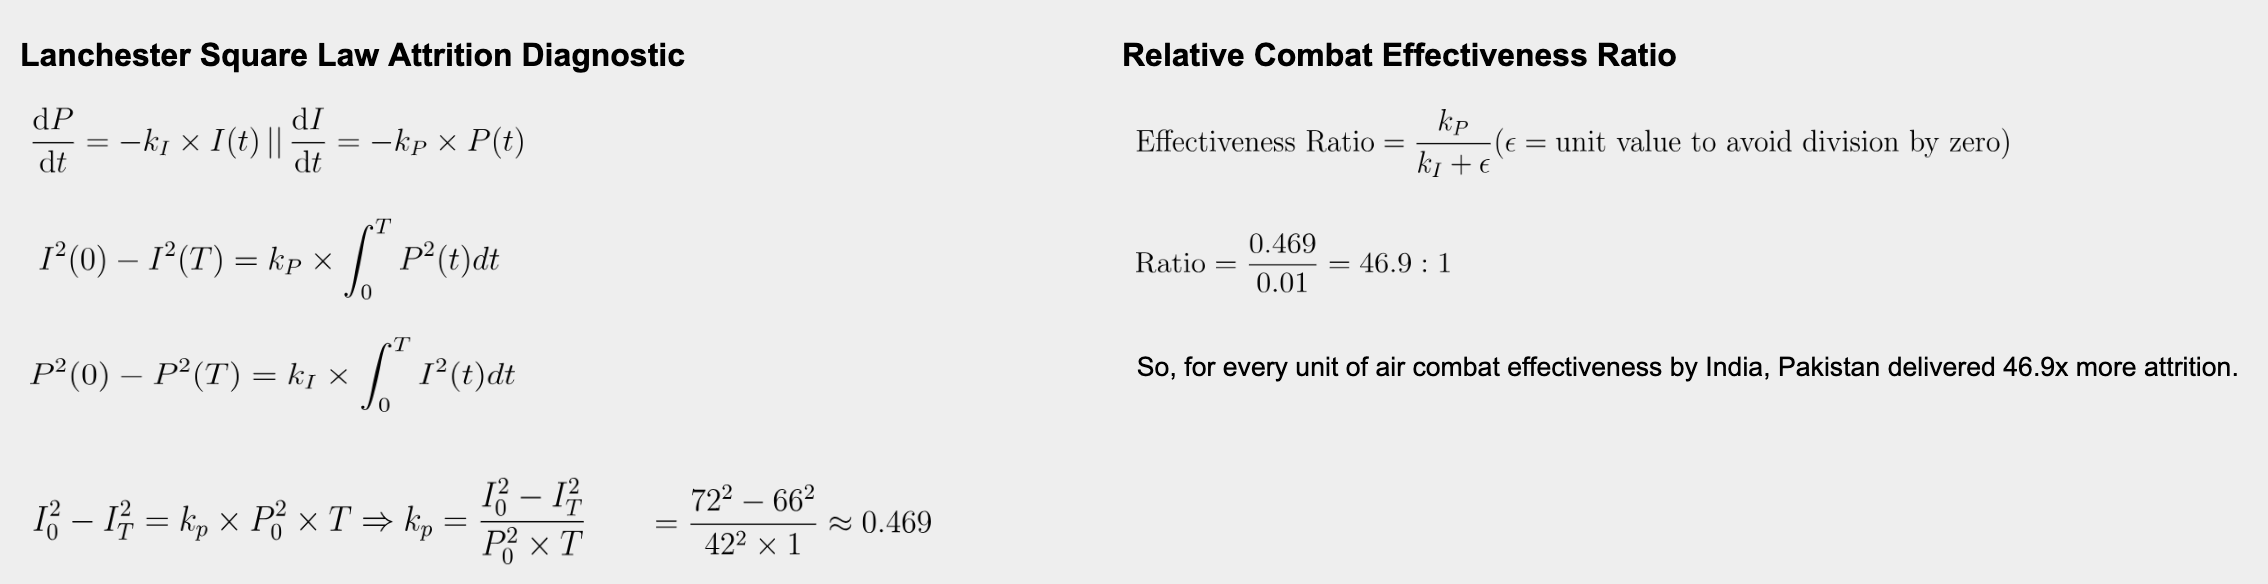
Lanchester Square Law and Relative Combat Effectiveness Ratio
With a glaring failure of 6–nil, we can only apply a simplified Lanchester’s Square Law. The actual equations model attrition rates over time between two opposing forces. But with 6 confirmed kills over 1 hour, the PAF’s attrition coefficient for India comes out to k_P = 0.469. In clear terms: for every unit of Indian air combat power, PAF delivered 46.9x more attrition. That number isn’t symbolic — it’s kinetic. It means each Pakistani aerial asset delivered half a square unit of Indian force kill-power every hour. That’s not air superiority. That’s annihilation mathematics. A level of combat efficiency three times above symmetric expectations. This was system-first warfare — a concept Indians will understand in decades while Pakistanis will have evolved further. It wasn’t just that India was outflown — they were out-looped. First launch. First kill. Then complete denial. PAF mounted its complete shooter package within 3 to 10 mins. Peak lethality was achieved in the first 15–20 mins. And then complete smacking of whatever Indians threw in for the next 40-45 mins. Insane!
Lanchester Square Law Attrition Diagnostic
$$\frac{dP}{dt} = -k_I \times I(t) \quad || \quad \frac{dI}{dt} = -k_P \times P(t)$$
$$I^2(0) - I^2(T) = k_P \times \int_0^T P^2(t)dt$$
$$P^2(0) - P^2(T) = k_I \times \int_0^T I^2(t)dt$$
$$I_0^2 - I_T^2 = k_p \times P_0^2 \times T \Rightarrow k_p = \frac{I_0^2 - I_T^2}{P_0^2 \times T} = \frac{72^2 - 66^2}{42^2 \times 1} \approx 0.469$$
Relative Combat Effectiveness Ratio
$$\text{Effectiveness Ratio} = \frac{k_P}{k_I + \epsilon} \quad (\epsilon = \text{unit value to avoid division by zero})$$
$$\text{Ratio} = \frac{0.469}{0.01} = 46.9 : 1$$
So, for every unit of air combat effectiveness by India, Pakistan delivered 46.9x more attrition.
That was partly the reason for my speculation before the engagement that this aerial battle would not be one of raw kinematics but of system integrity — and that the moment when a Rafale goes blind, the signal would be heard far louder than its physics. That precise moment is what appears to have unfolded. The disruption forced even the big boss of nonchalant India’s son-in-law-Vance in Washington and the BECA-aligned US command architecture to intervene diplomatically to contain the fallout, despite having Israelis taking the shots while sitting in Indian C2 centres. It was that loud.
The Aftermath
This is what realists at the Western helm of affairs don’t — and perhaps cannot — really factor in or understand. Pakistan cannot be just “smashed” in a conventional engagement either. The martial asymmetries are mysterious — and in favour of Pakistan ever since.
And it’s not just the present — it recalibrates the future. By India’s own platform logic, Bayesian updating pushes PAF’s probability of winning a future BVR battle to over 70%. For IAF? Below 30%. PL-15s, too, have now edged into top-tier BVR missile status — with a real-world kill probability of ~0.36, matching or exceeding the AIM-120D with superior range.
But this battle wasn’t won by missiles. It was won by doctrine. By integration. By systems. This is what PAF has built — quietly, patiently, in shadows. While India spent $15B after Op Swift Retort to buy Rafales, advanced air defence including S-400s, BECA and other force-building instruments, PAF built network parity and asymmetry under $5B. They war-gamed against and closely studied Qatari Rafales, simulated Chinese S-400s, had already exercised against US supercarriers, studied P-800 Oniks (BrahMos) equivalents, and rehearsed the highest level of BVR battles in Shaheen exercises with PLAAF EW and space warfare gems on SOJs, J-10Cs, and J-16Ds. They then established a plethora of indigenous technologies — including those that people mistake for Turkish or Chinese, like the YiHA-III, KaGeM V3, CM-400AKG, etc. Many of these platforms are either OEM developments per Pakistani specs and engineering, or jointly developed or produced. PAF trained to blind. To jam. To overrun. To dominate. And when the day came, they didn’t react. They executed.
The biggest surprise for Indians was in the cyber domain, in which PAF said it never fully deployed all it has. The highlight of the cyber payload was satellite ISR and comm disruption — with a very likely hacking of Indian GSAT-7A, IAF’s primary comm satellite. Apart from that, in the space domain, PAF had the backing of the Chinese for sure. China arguably has the world’s best or top-most kill chain integration using 13 dedicated military comm satellites — out of a total of 166 in 15 constellations.
It will take generations for Indians to replicate that — to develop a system, network, and pack-hunting into their operational DNA. No matter how much they spend on platforms and assets, the outcomes will remain the same. IAF didn’t just meet an air force. It met a network. This was not just a battle won — it was a system war executed with precision.
PAF didn’t outperform; they overrode the engagement architecture. IAF didn’t just underdeliver; they never got into the game.
We can probabilistically reason what PAF did during Op Bunyan um Mursus, too, with S-400s. And had PAF been allowed to carry out what it asked for, post-Bholari, Indian losses would have been strategic – way past the tactical humiliation it received globally.
This is going to be studied. Taught. Cited. Precise. Surgical. Textbook.
Note
The relevent threads I made on X at that time are here